Project Excel and Spreadsheet
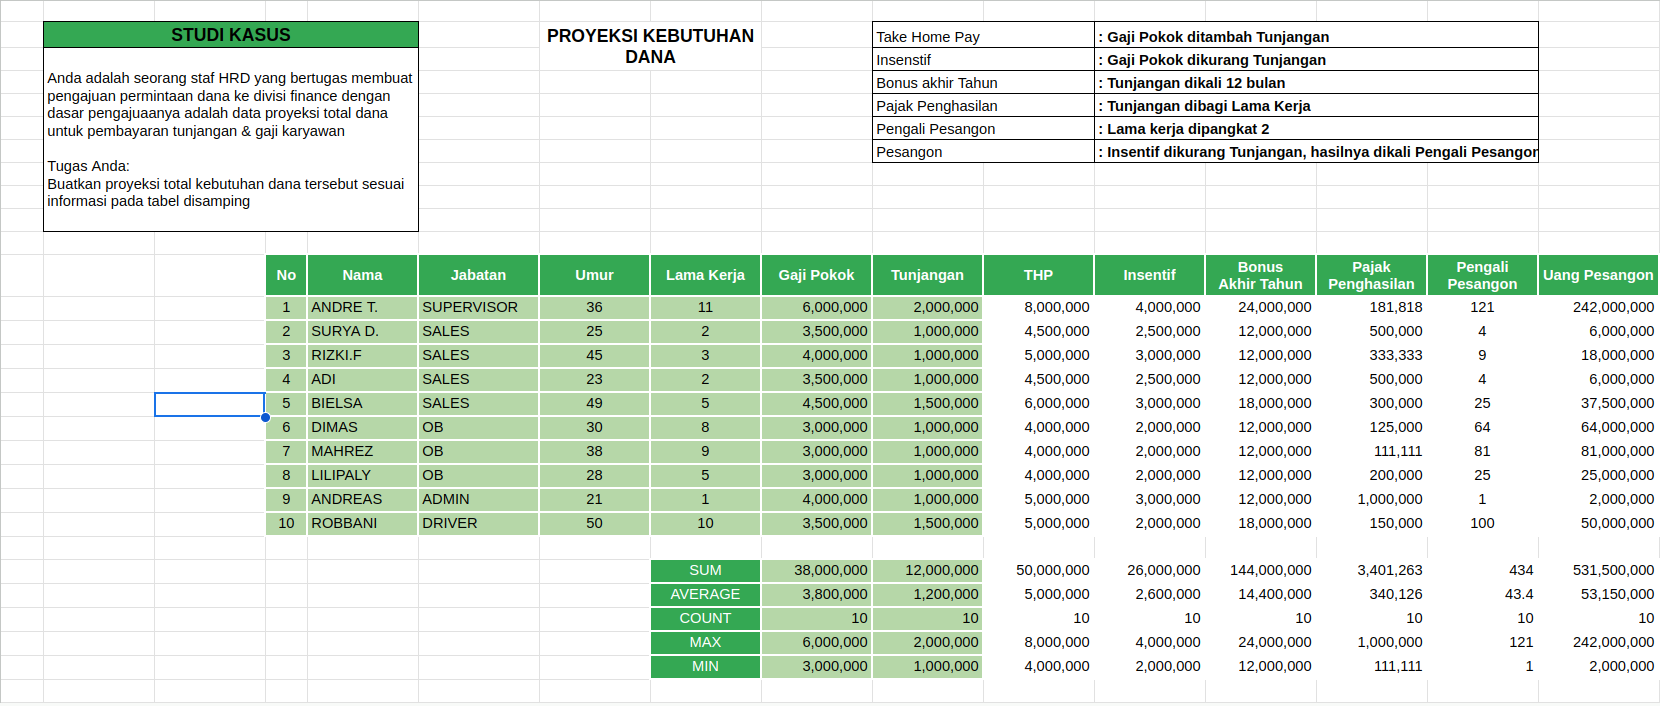
Basic Aritmetics
This project showcases my journey with Excel, where I mastered basic arithmetic functions. I learned how to use addition, subtraction, multiplication, and division formulas effectively. These skills were applied in various tasks, improving my data organization. The project illustrates how simple functions can streamline work processes.
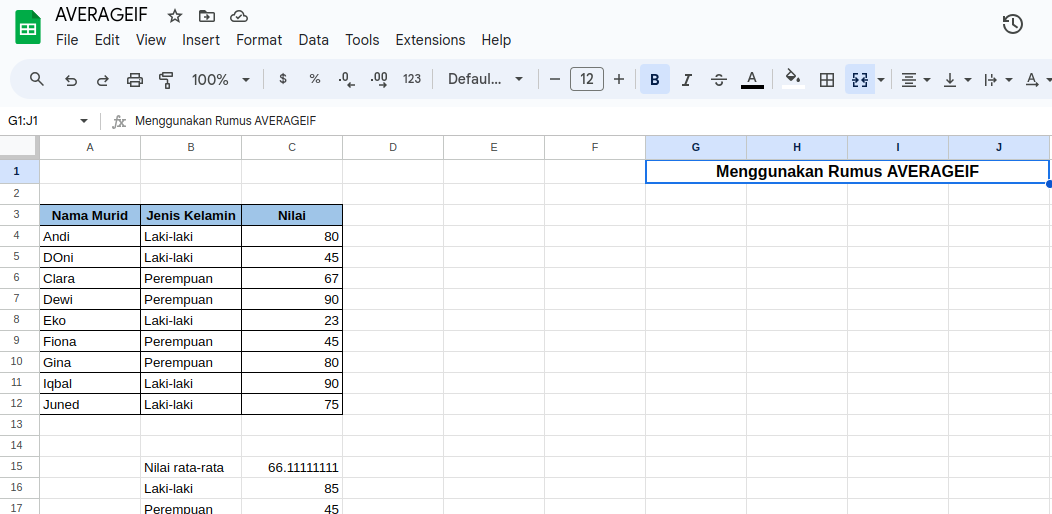
Average If
This project focuses on the use of the `AVERAGEIF` function to calculate averages based on specific criteria. I applied this function to filter data and obtain meaningful insights. The project demonstrates how to efficiently summarize data sets using averageif. I also used it for basic reporting and analysis in spreadsheets.
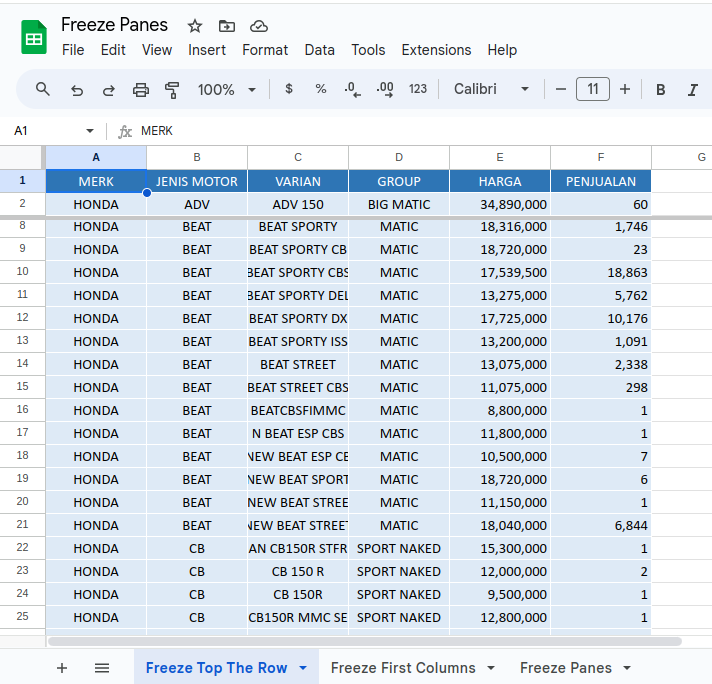
Freeze Panes
In this project, I explored the `Freeze Panes` feature in Excel to lock specific rows and columns. This function allows for easier navigation in large data sets. The project involved managing and analyzing data across multiple sections. By using `Freeze Panes`, I ensured that important headers remained visible throughout the worksheet.
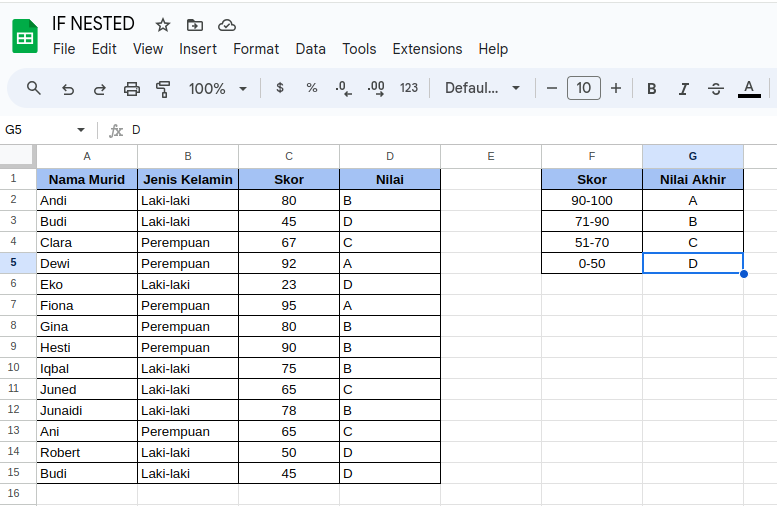
If Nested
This project demonstrates the use of nested `IF` statements to create complex conditional logic in Excel. I used this technique to evaluate multiple criteria within data sets. The project shows how to make data-driven decisions. These skills have been crucial in managing spreadsheets with varying conditions and outputs.
Pivot Table
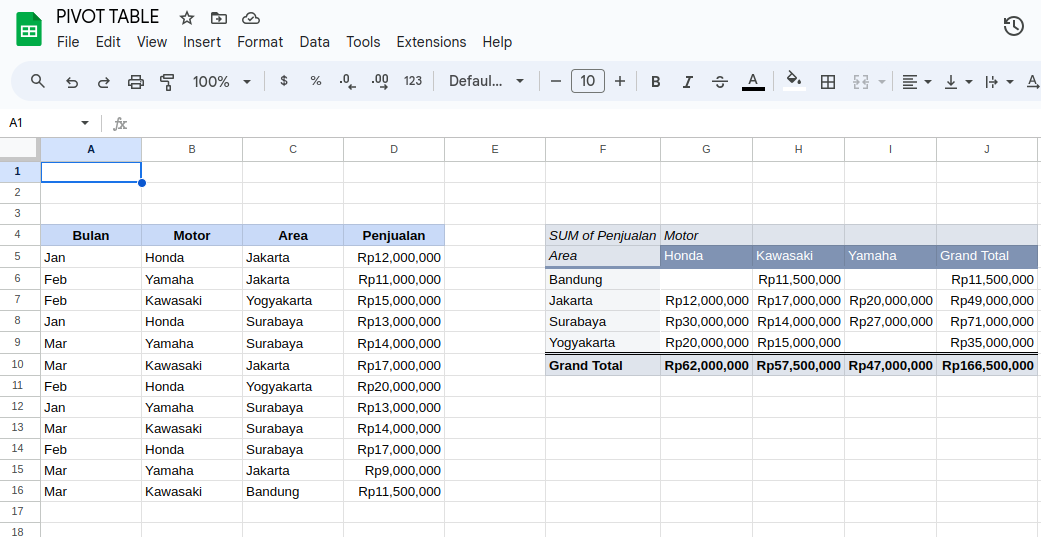
In this project, I used pivot tables to summarize and analyze large data sets from course that i have. The tool allowed me to create dynamic reports by sorting, filtering, and organizing data. I applied this function to generate meaningful insights quickly. The project highlights the versatility of pivot tables in handling complex data.
Monthly Budget
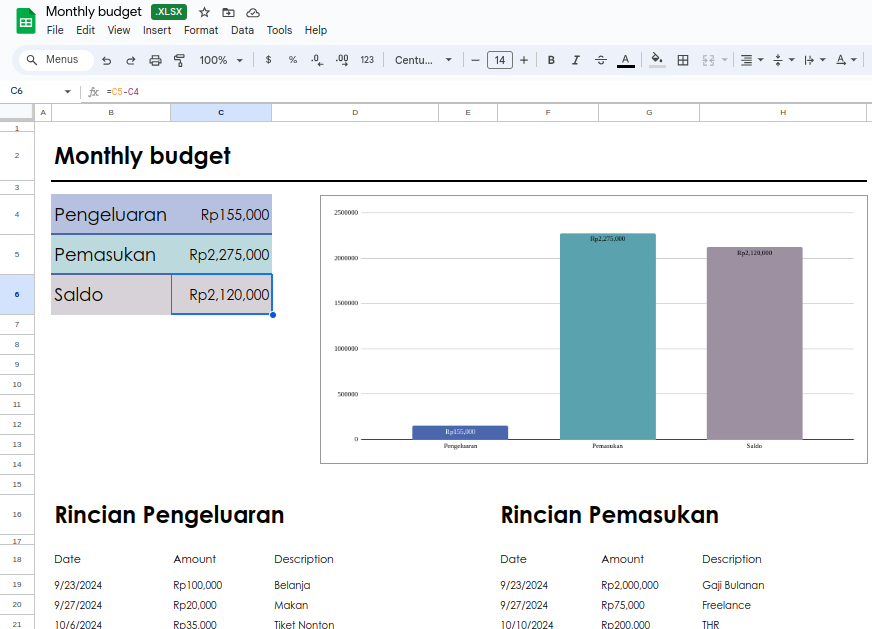
This project focuses on tracking personal finances using Excel's budgeting templates. I built a system to monitor expenses, compare monthly income, and plan future spending. The project illustrates how Excel can be used to create detailed financial reports. I utilized charts and formulas to visualize trends and manage budgets effectively.